16 October 2019, Nordic Innovation gathered 45 actors working with scale-up programs, data collection or research in Brussels, to discuss, learn and share knowledge across Europe.
Peter Bøegh Nielsen from Statistics Denmark kicked off the first session by presenting the brand-new report Scale-ups in the Nordics 2017. A follow-up on Scale-ups in the Nordics – Statistical Portrait 2008-2016 published earlier this year.

"We would be missing a lot if we only focused on employment.
– Peter Bøegh Nielsen, Statistics Denmark
The follow up report was made to create a more precise and telling picture of the Nordic scale-up landscape, looking at export-oriented industries. Most statistical analyses focus only on employment growth but this study extends the analysis to turnover growth. As Peter Bøegh Nielsen pointed out “We would be missing a lot if we only focused on employment, as we did in the first statistical report”.
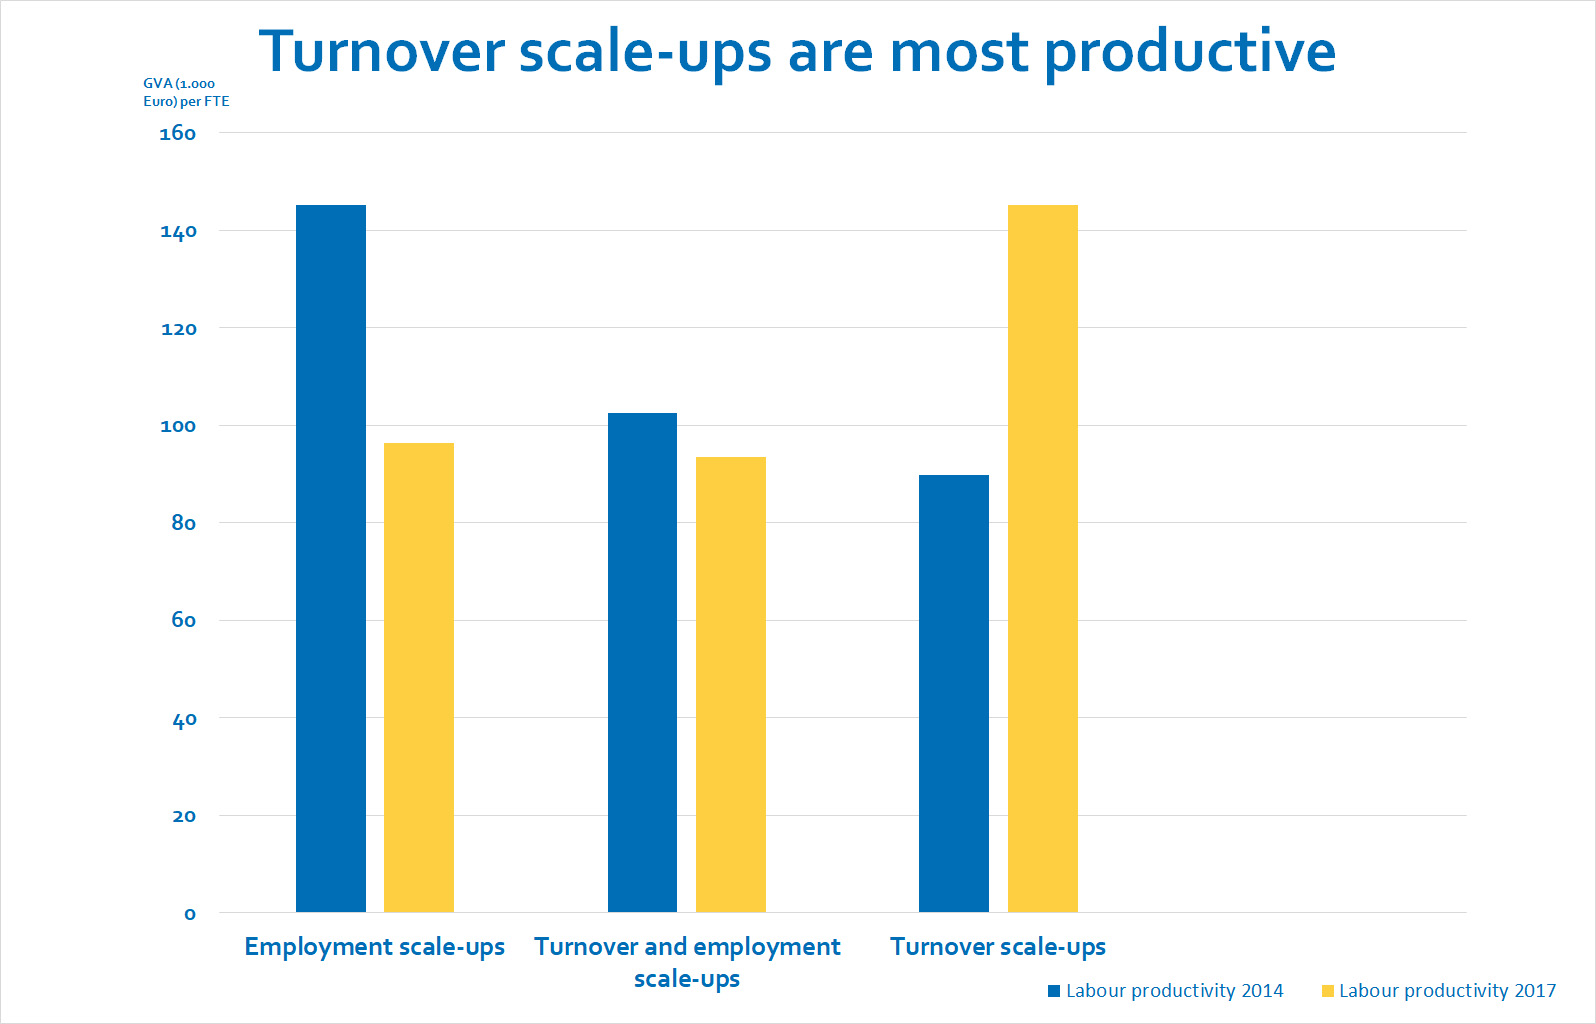
The 51% turnover scale-ups in the Nordics in 2017, generated a gross added value 50% higher than employment scale-ups.
- Scale-ups in the Nordics 2017
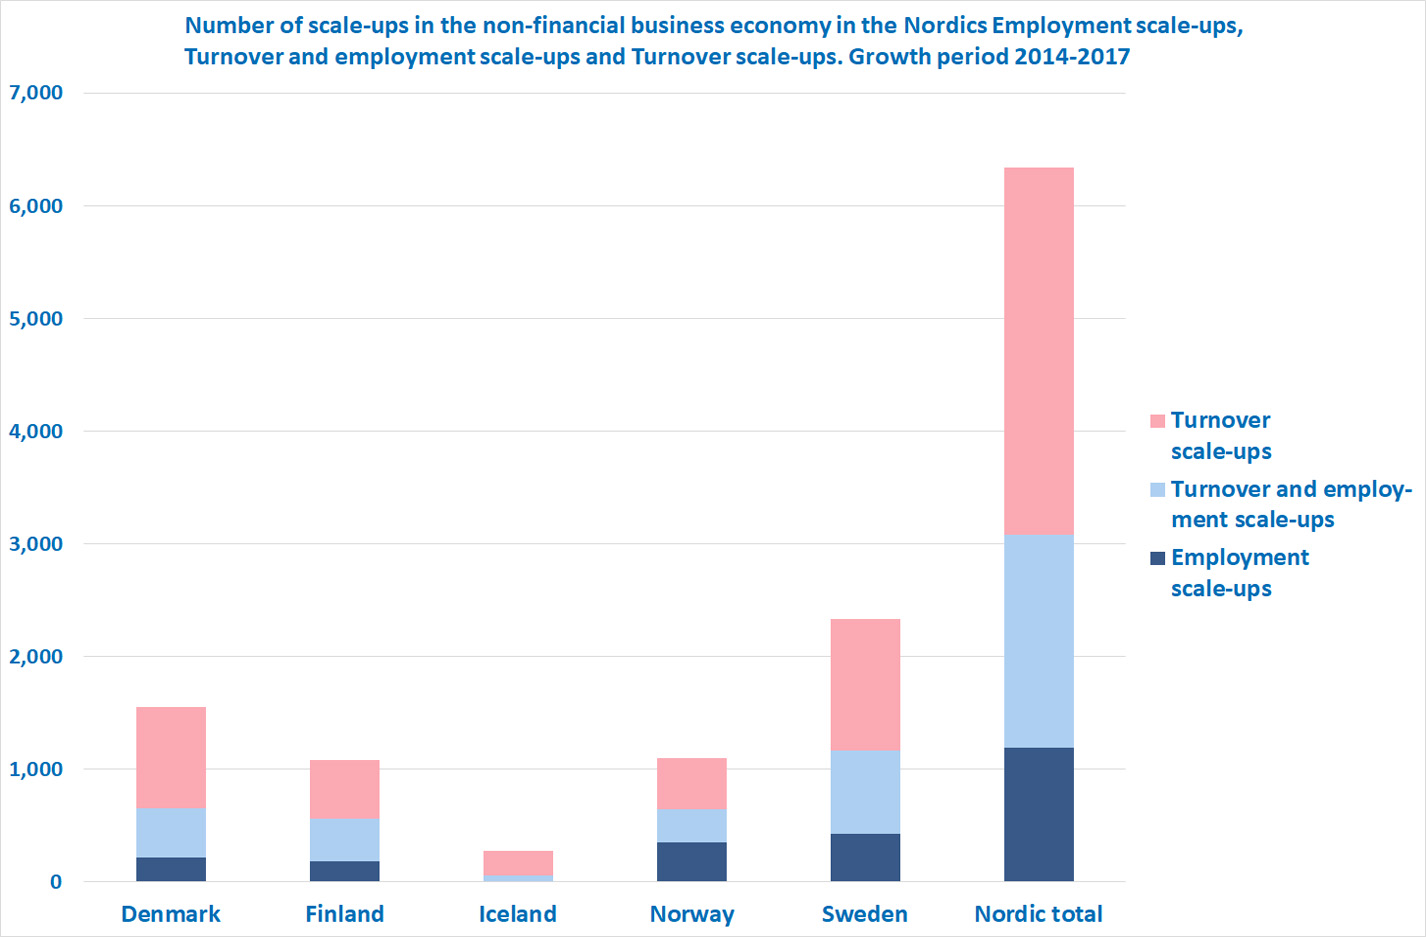
In the new report the definition of scale-ups has been further refined to also include growth in turnover. This allows a comparison between employment and turnover scale-ups, which has surprisingly different numbers. In the Nordics, 30% are Turnover and Employment scale-ups, 51% are Turnover scale-ups 19% are Employment scale-ups (see graph 1.1 below). The interesting point being that turnover scale-ups generate a gross added value 50% higher than employment scale-ups, generating an average of 145,000€ per employee (see graph 2.7).

1.1 *Scale-ups in the Nordics 2017
72,500 jobs
The importance of scale-ups contribution to employment is also highlighted. In the Nordics, exporting scale-ups within manufacturing and wholesale and scale-ups within knowledge-intensive services only constitute 0.12 percent of all enterprises, but contribute with 2.6 percent of the total employment, as well as 3.7 percent of the total turnover in 2017. Which means that scale-ups created 72,500 jobs, a growth rate of 74% from 2014 to 2017.

2.7 *Scale-ups in the Nordics 2017
There is a need for tailor-made statistics
"When we started to prepare for Nordic Scalers in early 2017, it became clear that we lacked evidence base and data on Nordic scale-ups", explains Anna-Maija Sunnanmark, Senior Innovation Adviser at Nordic Innovation.
We want to make Nordic scale-ups visible since this is the only way we can effectively support these companies.
Anna-Maija Sunnanmark, Nordic Innovation
Sunnanmark, who has been part of the group behind the Nordic Scalers initiative, quickly saw the need for data "...that is why we initiated the two statistical analyses in cooperation with the Nordic statistical offices. They’ve done a ground-breaking job which other European countries now want to follow. Their work has helped us to develop a more comprehensive picture on the Nordic scale-up landscape. We want to make Nordic scale-ups visible since this is the only way we can effectively support these companies".
Bøegh Nielsen continues: “The project underlines the importance of statistical evidence for policy-making by new and innovative ways of utilizing existing statistical data to produce tailor-made statistics”. Today there are differences in the statistical material available in Europe, but with the two statistical reports on the Nordic scale-up landscape, we have taken a leap towards documenting and understanding the importance of scale-ups and their needs.
Further reading
The report also highlights the division between organic growth and mergers and acquisitions in scale-ups, as well as look at the national differences in numbers and location of scale-ups.
Want to know more? You can download the entire report here.
The report is made by the five Nordic statistical offices, commissioned by Nordic Innovation as a part of the Nordic Scalers initiative.


